AskCSV

About AskCSV
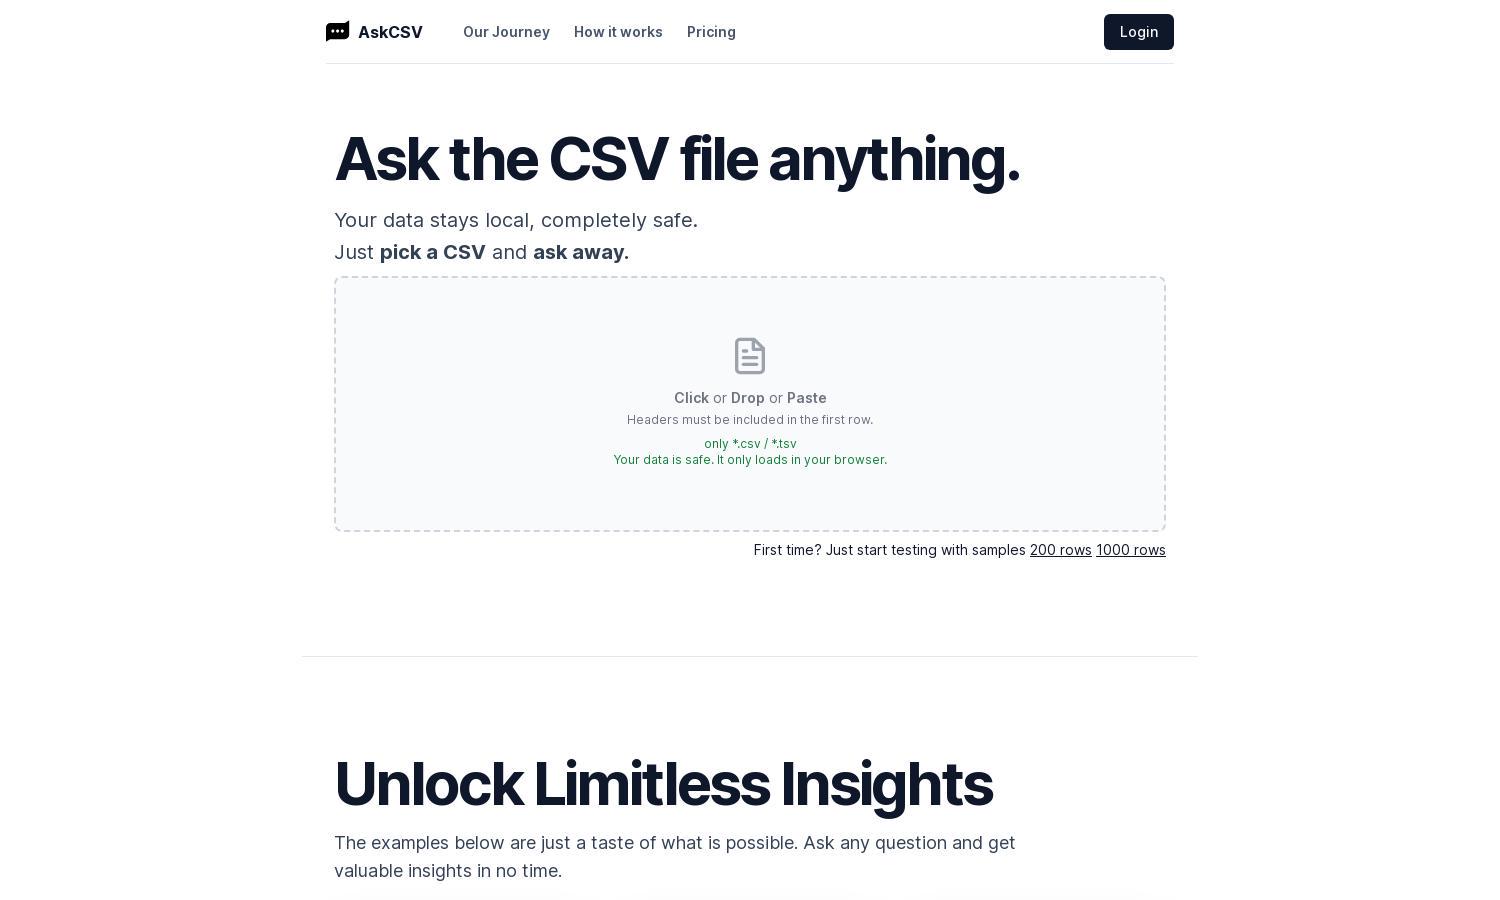
AskCSV is an innovative platform designed to make data analysis straightforward and secure. Targeted at data enthusiasts and business professionals, AskCSV allows users to upload CSV files and ask questions about their data directly in their browser. This unique approach ensures ease of use while prioritizing data privacy.
AskCSV offers a free tier to get started with basic features, while a premium subscription unlocks advanced functionalities, including higher data limits and enhanced insights. Users can explore various pricing plans that cater to their analytical needs, ensuring valuable returns on their data investments.
The user interface of AskCSV is designed for ease and efficiency, providing a seamless experience for data analysis. A clean layout and intuitive navigation help users quickly access their uploaded files and analytical features, ensuring that data insights are always just a question away.
How AskCSV works
Users start by uploading their CSV files to AskCSV, which processes the data locally in the browser for maximum privacy. They can then ask specific questions about their data, such as trends or comparisons. The AI analyzes the queries and generates insightful visualizations and summaries, streamlining the data analysis process.
Key Features for AskCSV
AI-Powered Data Insights
AskCSV leverages cutting-edge AI technology to provide powerful insights directly from your CSV files. This feature enables users to extract valuable information quickly, ask complex questions, and receive tailored visual representations, enhancing the overall data analysis experience.
Local Data Processing
With AskCSV’s focus on security, all data processing happens directly within your browser, ensuring complete privacy. This unique feature allows users to analyze CSV files without uploading them to a server, thus eliminating risks associated with data breaches and unauthorized access.
Interactive Data Visualization
AskCSV excels in transforming raw data into interactive visualizations, making data insights easily digestible. Users can request various chart types and see their data represented visually, aiding in better understanding and decision-making processes.
You may also like:


