Best Analytics & Data tools (8+)
Discover 8+ best analytics & data tools. Compare features, pricing, and reviews. Free and paid options available.
Crawlkit
CrawlKit is an API-first web scraping platform that lets developers extract data, search results, screenshots, and LinkedIn insights from any website.
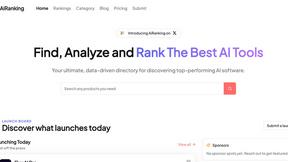
AiRanking
Your ultimate, data-driven directory for discovering top-performing AI software.
MultiMMR
Connect your Stripe accounts and get a unified view of your SaaS portfolio. Real-time metrics, beautiful charts, and no more spreadsheet chaos.
Customer Feedback
Collect what people think, turn it into insights, and keep your community in the loop.
Skippership
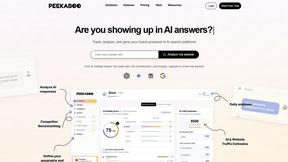
Skippership helps you find and fix where users get stuck with AI-powered behavior analysis.
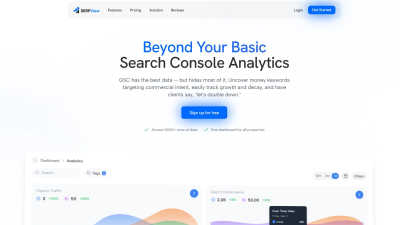
SERPView
GSC has the best data - but hides most of it. Uncover money keywords targeting commercial intent, easily track growth and decay, and have clients say.
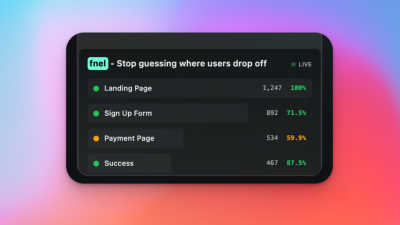
fnel
Lightweight funnel analytics for solo founders. One-line setup, instant tracking, real-time drop-offs and conversion insights.
FAQs for Analytics & Data
How does the Analytics & Data Category enhance decision-making?
The Analytics & Data Category enhances decision-making by providing organizations with robust tools for analyzing trends and patterns in their data. By harnessing actionable insights, decision-makers can make informed choices that drive business strategies, improve operational performance, and meet organizational goals more effectively.
What unique features does the Analytics & Data Category offer?
The Analytics & Data Category offers unique features like real-time data analysis, predictive analytics, and various data visualization tools. These functionalities enhance user engagement, support data-driven strategies, and help organizations respond swiftly to market dynamics while optimizing their operations.
In what scenarios is the Analytics & Data Category most beneficial?
The Analytics & Data Category is most beneficial in scenarios such as market research, operational efficiency analysis, and customer segmentation. By applying analytics, organizations can gain deep insights into their performance and market trends, allowing them to optimize strategies and meet customer demands effectively.
What competitive advantage does the Analytics & Data Category provide?
The Analytics & Data Category offers a competitive advantage by equipping organizations with the tools to leverage data for strategic insights, thus driving innovation and efficiency. Its unique features, such as predictive modeling and interactive dashboards, differentiate organizations in their ability to make proactive decisions.
How does the Analytics & Data Category solve common business problems?
The Analytics & Data Category addresses common business problems by providing insights that lead to better resource allocation, improved customer targeting, and enhanced operational efficiency. It empowers companies to identify issues swiftly and take corrective actions based on data-driven findings.
How do users benefit from the features of the Analytics & Data Category?
Users benefit from the features of the Analytics & Data Category by gaining access to improved data analysis capabilities, leading to informed decision-making and strategic insights. These tools allow for greater flexibility and responsiveness in operational strategies, ultimately enhancing overall business performance.
You may also like
Legal
The Legal Category enhances legal processes through AI tools, boosting efficiency.
VR & AR
Discover the VR & AR Category, enhancing user engagement through immersive experiences.
Avatars
Avatars Category offers personalized digital representations, enhancing engagement and user interaction in virtual settings.
Business Intelligence
The Business Intelligence Category empowers effective decision-making through data insights, enhancing competitiveness.
E-commerce
E-commerce Category provides robust tools for online sales, enhancing business growth.
Development
The Development Category offers essential tools that boost developer productivity and streamline processes for efficient software creation.
Video
The Video Category simplifies video content discovery and optimization in AI Directories.
Copywriting
The Copywriting Category focuses on persuasive content creation, enhancing engagement and conversions.


