Hex

About Hex
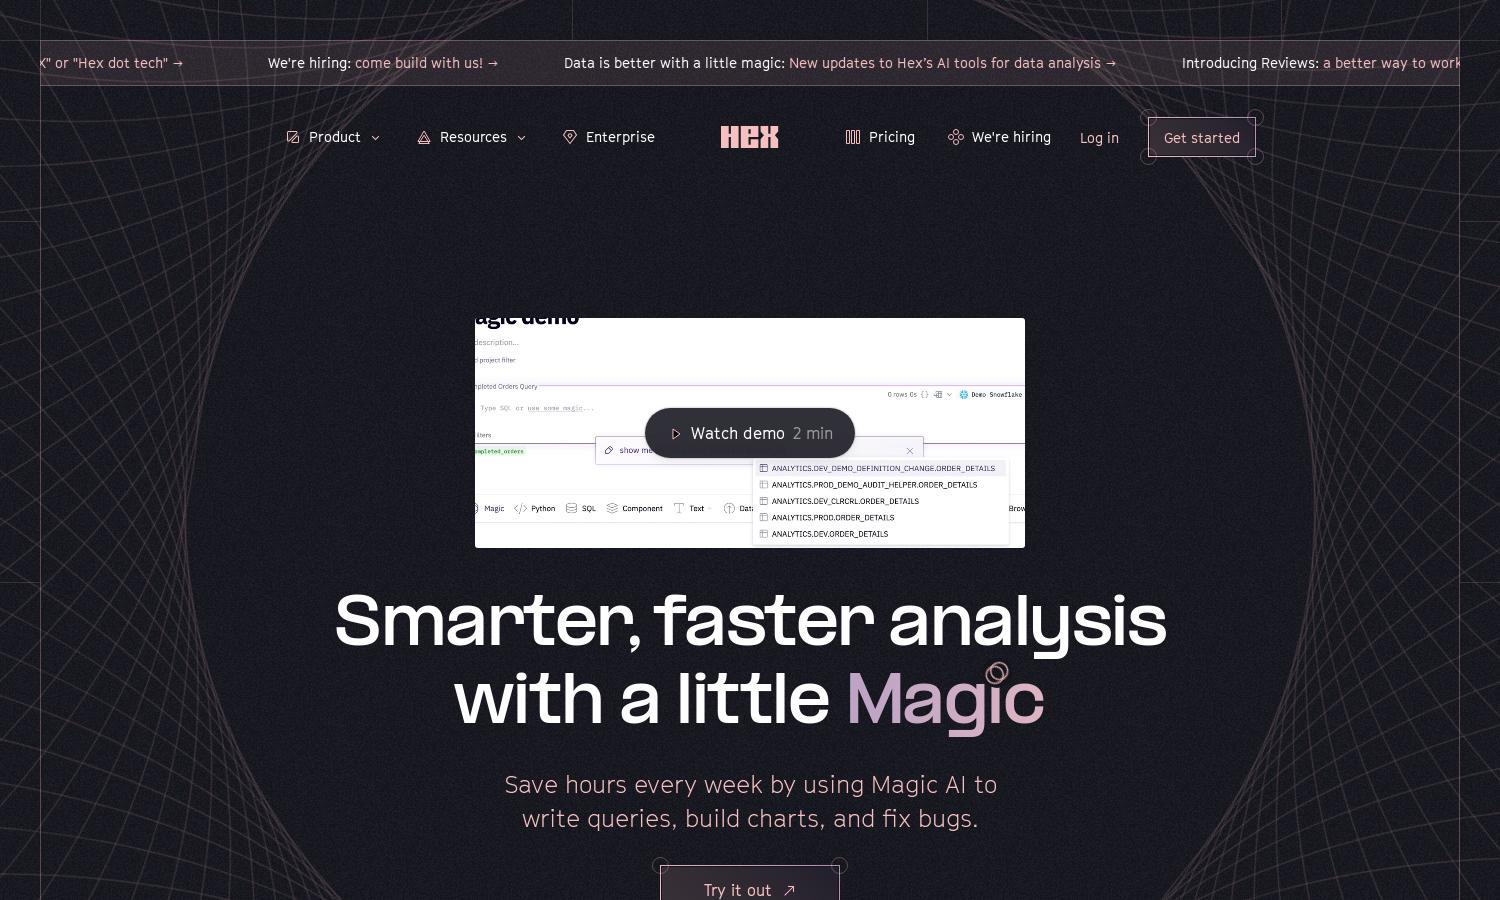
Hex is a data analysis platform designed for data professionals seeking faster, smarter analysis. It harnesses the power of AI to streamline query writing, chart creation, and debugging, making data insights more accessible. With its unique Magic AI feature, Hex transforms complex data tasks into simple commands for improved efficiency.
Hex offers flexible pricing plans tailored for teams and businesses. Users can choose from standard to premium tiers, each offering unique benefits such as advanced analytics capabilities and enhanced collaboration tools. Upgrading allows access to more features, optimizing data processes and team performance effectively within Hex.
Hex's user interface is designed for intuitive use, featuring a clean layout that streamlines navigation. Its innovative design allows users to easily access Magic AI and data tools, fostering a seamless experience for data analysis. This user-friendly approach enhances productivity, making Hex the go-to platform for data-driven tasks.
How Hex works
Users begin their experience with Hex by signing up and onboarding, which introduces them to the platform's key features. They can then navigate the intuitive dashboard to access Magic AI, input queries, and generate insights. Hex simplifies the analytical process by chaining commands, enabling users to seamlessly switch between SQL and Python tasks for comprehensive data analysis.
Key Features for Hex
Magic AI
Magic AI is a standout feature of Hex, enabling users to autonomously generate SQL queries and charts. This innovative tool drastically reduces the time spent on coding and troubleshooting, making it an invaluable resource for data professionals aiming to work smarter and faster while maintaining accuracy.
Automated Debugging
Automated debugging is another key feature of Hex that enhances user experience. It proactively identifies and resolves issues in queries, allowing data analysts to focus on deriving insights rather than fixing errors. This capability saves time and minimizes frustration, making Hex an essential tool for data teams.
Integrated Data Visualization
Integrated data visualization in Hex transforms raw data into meaningful charts and graphs effortlessly. Users can create interactive visuals with simple commands, boosting their analytical storytelling capabilities. By incorporating this feature, Hex enables users to present data insights compellingly, enhancing presentations and decision-making.
You may also like:


