Pie Chart Maker
About Pie Chart Maker
Pie Chart Maker is an intuitive online tool designed for users needing quick and professional pie charts. With the ability to upload Excel/CSV files and customize designs in real-time, it offers a seamless experience that enables everyone, from students to professionals, to visualize data effectively.
Pie Chart Maker is completely free with no subscription plans; users enjoy unlimited access without hidden fees. Since there's no registration required, users can instantly create pie charts, with added features available for those looking to level up their visualization experience.
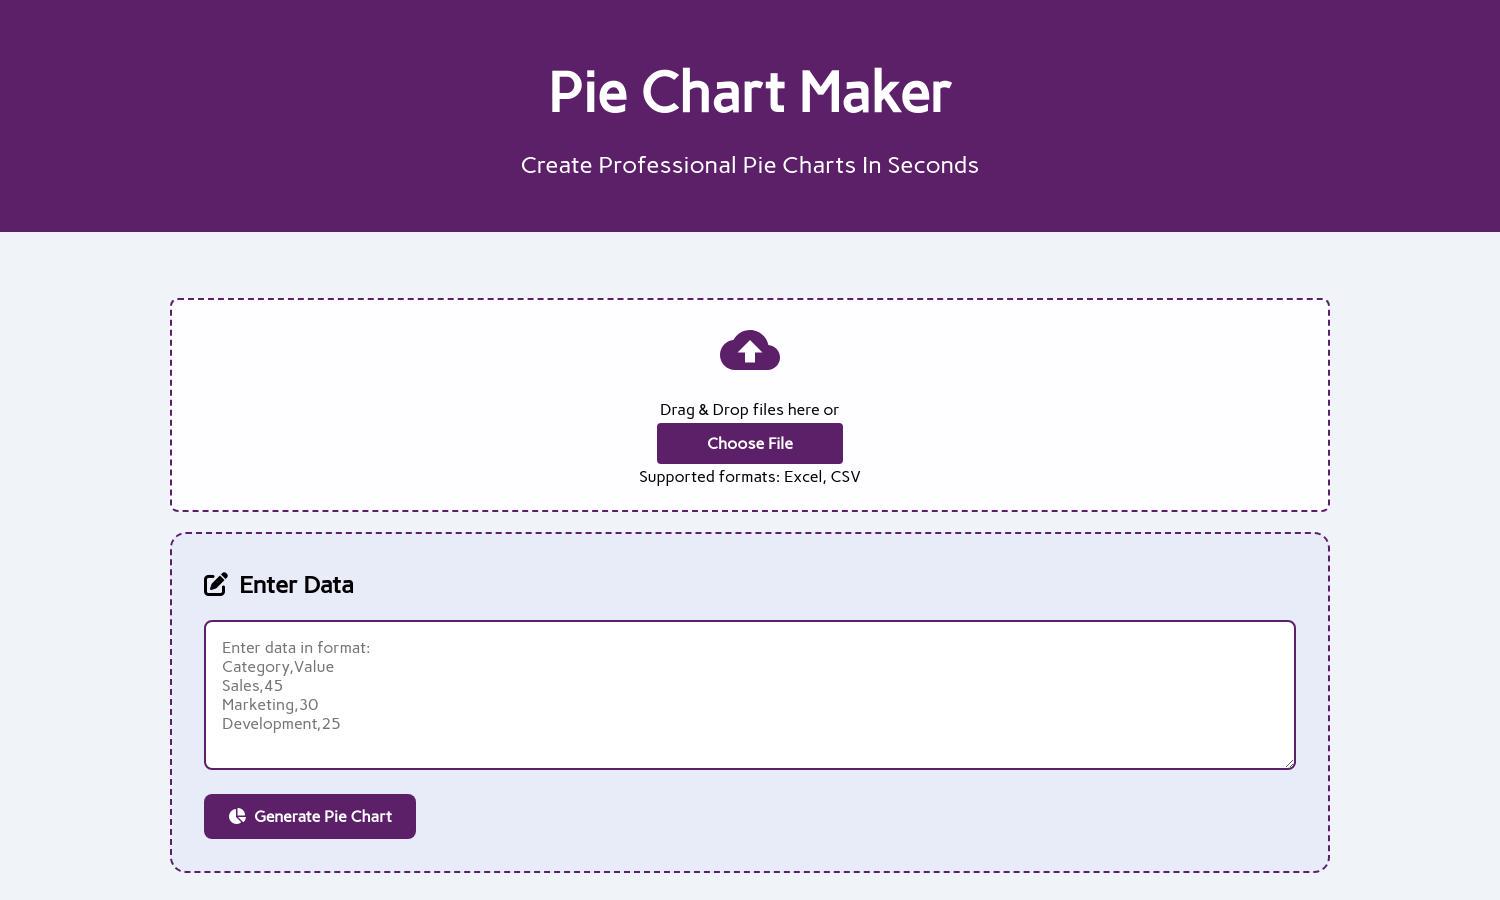
The user interface of Pie Chart Maker is designed for simplicity and effectiveness. Its clean layout, real-time previews, and easy data input options ensure a smooth experience, allowing users to create stunning pie charts effortlessly and share them across various platforms without any hassle.
How Pie Chart Maker works
Users interact with Pie Chart Maker by first visiting the site and choosing to upload their Excel or CSV files or pasting data directly. The platform provides a user-friendly interface for customizing colors and labels, allowing for immediate previews. Once satisfied, users can download or embed their pie charts easily.
Key Features for Pie Chart Maker
Instant Data Visualization
Instant Data Visualization is a standout feature of Pie Chart Maker, allowing users to generate pie charts within moments. Simply input your data, and the site instantly creates beautiful visuals, making data representation effortless and efficient for any user.
Custom Design Options
Custom Design Options at Pie Chart Maker enable users to tailor their pie charts uniquely. Adjust colors, slice positions, and labels effortlessly, ensuring every chart looks professional and is aligned with user preferences, greatly enhancing the presentation of data.
Mobile-Friendly Design
Pie Chart Maker features a mobile-friendly design, allowing users to create pie charts seamlessly on any device. This versatility ensures that whether on smartphones or tablets, users can easily visualize their data anytime, anywhere, making it a convenient choice for all.
You may also like:
