Dividend Data vs GrowPanel
Side-by-side comparison to help you choose the right tool.
Dividend Data
Evolve your investment analysis with instant, automated stock data directly in your spreadsheets.
Last updated: March 11, 2026
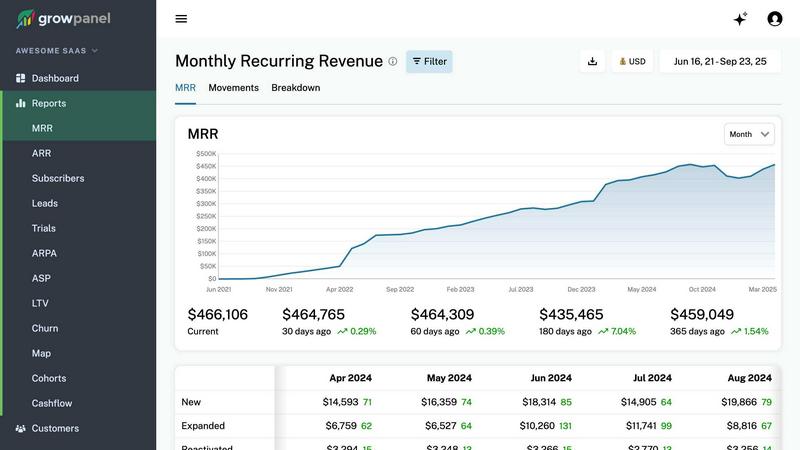
GrowPanel
GrowPanel delivers real-time subscription analytics to boost your SaaS growth and optimize revenue effortlessly.
Last updated: February 28, 2026
Visual Comparison
Dividend Data

GrowPanel
Feature Comparison
Dividend Data
Comprehensive Spreadsheet Integration
Dividend Data seamlessly integrates directly into your existing workflow within Google Sheets and Microsoft Excel via dedicated add-ins. This feature requires no API keys, coding knowledge, or complex setup. You gain access to a suite of over 16 custom functions that pull live data directly into your cell formulas. This transforms static spreadsheets into dynamic, auto-updating financial models and dashboards, saving countless hours of manual data entry and ensuring your analysis is always based on the most current information available.
Extensive Historical & Fundamental Data Library
Access a deep well of financial information spanning more than three decades for a global universe of 80,000+ stocks and ETFs. The library is meticulously built for fundamental analysis, covering dividend-specific metrics (ex-dates, payment dates, growth rates), full financial statements (income, balance sheet, cash flow), valuation and profitability ratios (P/E, P/B, ROE), and detailed price history. This depth allows investors to perform rigorous back-testing, analyze long-term trends, and make informed decisions based on comprehensive historical context.
Built-for-Purpose Dividend Investor Tools
The product is specifically engineered with dividend-focused metrics at its core. Functions are designed to instantly retrieve forward dividends, yields, payout ratios, and dividend growth histories. This specialized focus means investors can quickly screen for income stability, assess dividend safety, and model future income streams without having to manually calculate these figures from raw data, streamlining the entire research process for income-generating portfolios.
Free Tier with Perpetual Access
Dividend Data fosters long-term user growth by offering a genuinely free starting point. The free plan provides 2,500 credits per month without any trial expiration date, allowing new investors to explore the platform's capabilities, build small models, and integrate data into their process at zero cost. This low-barrier entry encourages skill development and demonstrates tangible value, creating a natural pathway for users to evolve into power users who may later choose to upgrade for higher-volume needs.
GrowPanel
Real-time MRR, ARR, Churn, and LTV Tracking
GrowPanel provides real-time tracking of key financial metrics such as Monthly Recurring Revenue (MRR), Annual Recurring Revenue (ARR), churn rates, and Customer Lifetime Value (LTV). This allows businesses to monitor their financial performance at a glance, helping them make quick and informed decisions.
Trial Conversion and Cohort Analysis
This feature enables users to analyze trial user behavior and conversion patterns effectively. By offering insights into cohorts, businesses can identify trends, improve their conversion rates, and ultimately turn more trial users into paying customers.
Revenue Segmentation by Plan, Country, and More
With GrowPanel, users can segment their revenue data by various criteria, including subscription plan, geographical location, currency, or custom attributes. This flexibility helps businesses gain deeper insights into their revenue streams and target specific markets more effectively.
AI Chat for Instant Metric Queries
GrowPanel features an AI chat interface that allows users to query their metrics in plain language. Instead of navigating through complex dashboards, users can simply ask questions like "What is our churn rate this month?" and receive immediate, clear answers, streamlining their analytics process.
Use Cases
Dividend Data
Automated Dividend Portfolio Tracking
Investors can build a master portfolio tracker that automatically updates key metrics. By using formulas to pull current prices, dividend yields, and annual income per holding, you can create a live dashboard that shows total portfolio value, projected annual dividend income, and average portfolio yield without ever manually looking up a stock price or dividend announcement again.
Fundamental Stock Screening & Analysis
Quickly screen and analyze potential investments by building custom filters in a spreadsheet. Use functions to pull P/E ratios, debt-to-equity, ROIC, and dividend growth rates for a list of tickers. This allows for rapid comparison of financial health and valuation across dozens of companies to identify those that meet specific, rigorous investment criteria for further due diligence.
Historical Performance Back-testing
Test investment strategies or analyze a company's historical financial resilience. With 30+ years of data, you can pull annual revenue, EPS, and dividend payments into a sheet to chart long-term trends, calculate compounded dividend growth rates, or see how key ratios have changed through different market cycles, providing evidence-based context for future expectations.
Dynamic Financial Model Creation
Create sophisticated discounted cash flow (DCF) or dividend discount models (DDM) that use live data inputs. Instead of hard-coding assumptions, link your model directly to Dividend Data functions for current EPS, growth estimates, and risk-free rates. This ensures your valuation models are always up-to-date and can be recalculated instantly with new data.
GrowPanel
Optimizing Customer Retention
SaaS businesses can use GrowPanel to monitor churn rates and customer lifetime metrics, enabling them to implement targeted retention strategies. By understanding the reasons behind customer departures, companies can adapt their offerings and improve overall satisfaction.
Enhancing Trial User Conversions
With trial conversion insights, companies can better understand the behaviors of potential customers during their trial period. By analyzing this data, they can refine their onboarding processes and marketing strategies to convert more trial users into long-term subscribers.
Streamlining Cashflow Management
GrowPanel’s cashflow reporting feature allows businesses to track all revenue-related activities, including refunds, fees, and taxes. This comprehensive view of cashflow helps SaaS companies maintain a healthy financial state and make informed budgeting decisions.
Real-time Performance Monitoring
Businesses can leverage GrowPanel for real-time monitoring of key performance indicators. This immediate access to data enables teams to act quickly on emerging trends, making data-driven decisions that can positively impact growth trajectories.
Overview
About Dividend Data
Dividend Data is the definitive toolkit for the modern, self-directed investor, designed to bridge the gap between sophisticated financial analysis and practical, everyday use. It transforms your familiar spreadsheet environment—Google Sheets or Microsoft Excel—into a powerful, live-connected research terminal. The core mission is to eliminate the tedious, error-prone manual work of data gathering. Instead of copying, pasting, and constantly updating figures from disparate sources, you simply type intuitive custom formulas like =DIVIDENDDATA_DIVIDENDS("TICKER") to instantly pull in accurate, institutional-grade data. Built by a dividend investor for dividend and fundamental investors, it provides direct access to over 30 years of historical data for more than 80,000 tickers. This includes dividends, yields, payout ratios, growth rates, complete financial statements, key ratios, price history, and over 100 other essential metrics. The product evolves with your investing journey, starting with a generous free tier of 2,500 monthly credits that never expires, allowing you to build a foundational analysis practice without cost or commitment, and scaling to meet the needs of advanced portfolio management and deep-dive research.
About GrowPanel
GrowPanel is a cutting-edge subscription analytics platform designed specifically for SaaS companies aiming for clarity in their revenue metrics without enduring the complexities of traditional spreadsheets. It provides users with seamless integration options, allowing them to connect their billing platforms like Stripe, Chargebee, and Recurly in just one click. Once linked, GrowPanel delivers real-time dashboards that display essential metrics such as Monthly Recurring Revenue (MRR), Annual Recurring Revenue (ARR), churn rate, retention, and expansion revenue, all backed by sophisticated cohort analysis. This enables businesses to gain a comprehensive understanding of their financial health and customer behavior, empowering them to make informed decisions that drive growth. With its user-friendly interface, AI-powered insights, and mobile-friendly design, GrowPanel is the perfect solution for SaaS companies looking to elevate their revenue management and analytics capabilities. Furthermore, it remains free for users until they reach an impressive $200k in ARR, making it a cost-effective choice for high-growth startups.
Frequently Asked Questions
Dividend Data FAQ
How does the free tier work and what are credits?
The free tier provides 2,500 credits every month, which renew automatically. Each data point retrieved by a formula (e.g., one cell with a price, a dividend yield, or an EPS figure) typically costs one credit. This allows for substantial usage for individual investors tracking a personal portfolio or conducting periodic research. There is no expiration on this free plan, so you can use it indefinitely.
Do I need to know how to code or set up an API?
Absolutely not. Dividend Data requires zero coding knowledge. You simply install the add-in for Google Sheets or Microsoft Excel from their respective marketplaces. Once installed, you can immediately start using the custom formulas like =DIVIDENDDATA_QUOTE("AAPL", "price") directly in your spreadsheet cells—no API keys or technical configuration is needed.
What kind of data can I access with the spreadsheet functions?
You can access a vast array of data points tailored for fundamental and dividend analysis. This includes real-time quotes, 30+ years of dividend history (dates, amounts), forward dividend metrics, complete financial statements (income, balance sheet, cash flow), key ratios (P/E, P/B, ROE), per-share metrics, and basic company information. Over 100 specific metrics are available through intuitive formula syntax.
Does it work in both Google Sheets and Microsoft Excel?
Yes, Dividend Data is fully functional in both major spreadsheet platforms. There is a dedicated Google Sheets add-on available in the Google Workspace Marketplace and a separate Microsoft Excel add-in available in the Microsoft AppSource store. The core set of functions and data access is consistent across both applications.
GrowPanel FAQ
How does GrowPanel integrate with my existing billing system?
GrowPanel allows seamless integration with popular billing platforms such as Stripe, Chargebee, and Recurly, enabling users to connect their accounts in just one click for instant data synchronization.
Is GrowPanel compliant with GDPR regulations?
Yes, GrowPanel is EU-hosted and fully compliant with GDPR, ensuring that your data is handled with the utmost security and respect for privacy regulations.
What types of companies can benefit from using GrowPanel?
GrowPanel is tailored for SaaS companies of all sizes, particularly those looking to gain clarity on their subscription metrics and streamline their revenue management processes.
Can I access GrowPanel on mobile devices?
Absolutely! GrowPanel is designed to be mobile-friendly, allowing users to access all their dashboards and reports on their smartphones without losing any functionality compared to the desktop version.
Alternatives
Dividend Data Alternatives
Dividend Data is a specialized financial data tool designed for fundamental and dividend investors. It provides direct spreadsheet integration, allowing users to pull decades of historical market data into Google Sheets and Excel with simple formulas. Users often explore alternatives for various reasons, such as budget constraints, the need for different feature sets like technical analysis or broader market coverage, or compatibility with other platforms like Python or dedicated trading software. The search for the right tool is a natural step in an investor's growth as their strategy and data demands evolve. When evaluating options, consider your core workflow. Key factors include the depth and reliability of historical data, ease of integration with your existing spreadsheets, transparent and scalable pricing, and whether the tool's focus aligns with your investment philosophy, be it dividends, value, or growth investing.
GrowPanel Alternatives
GrowPanel is a subscription analytics platform specifically designed for SaaS companies, offering clarity on revenue metrics without the confusion of spreadsheets. It provides real-time insights into key performance indicators such as MRR, ARR, churn, and LTV, making it an essential tool for businesses looking to optimize their financial performance. Users often seek alternatives to GrowPanel for various reasons, including pricing structures that better align with their budget, specific features that cater to unique business needs, or compatibility with different billing platforms. When choosing an alternative, it's essential to consider factors such as the accuracy of analytics, user interface, integration capabilities, and customer support to ensure that the solution aligns with your growth objectives and operational requirements.