

GeoRank
GeoRank evolves your relocation research from scattered data to a clear, AI-powered comparison of sunshine, cost, tax, and visa for any place on.
tool Details
About GeoRank
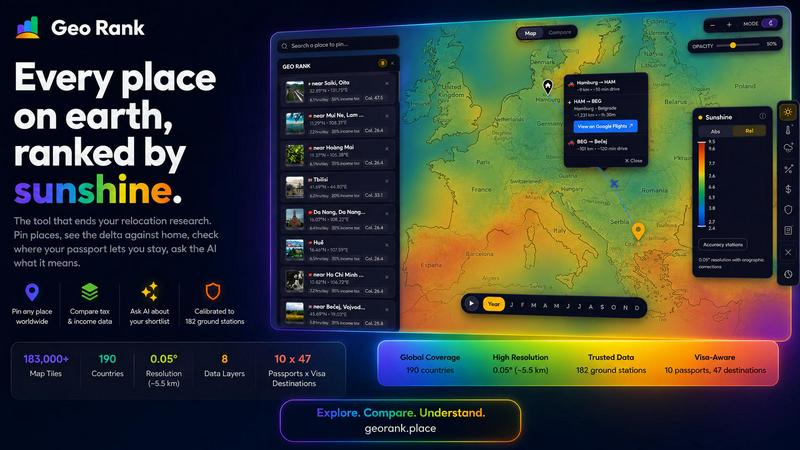
GeoRank is a free, no-signup interactive map designed to consolidate the chaotic process of international relocation research into a single, intelligent decision-making tool. It replaces the dozen open tabs of weather sites, Numbeo, embassy pages, and nomad forums with a unified platform that layers 8 distinct data sets over a global grid of approximately 5.5 km resolution. The product is built for digital nomads, remote workers, expats, and anyone considering a move abroad. Its main value proposition is to provide a structured, data-driven way to explore, compare, and understand locations based on personal priorities. By pinning candidate places and switching to Compare mode, users can see every metric as a delta against their current home, revealing whether a place is warmer, cheaper, safer, or taxed differently. The platform also features an AI assistant that reasons exclusively over the user's own shortlist, providing cited, grounded answers to complex questions like "which of my 5 places has the best winter?" GeoRank progresses the user from scattered browsing to a focused, comparative analysis, ultimately guiding them toward a confident relocation decision. It is a tool that evolves with the user, from initial global exploration to final location selection.
Features
Global Data Layering and Visualization
GeoRank offers 9 live, toggleable data layers that can be stacked and explored simultaneously on a high-resolution map. These layers include sunshine, temperature, rainfall, outdoor hours, tax rates, visas and residency routes, cost of living, geopolitical risk, and community-sourced "Nomad Pulse" sentiment. Each layer is powered by credible sources like SARAH-3 satellite data, ERA5 reanalysis, OECD tax databases, and cost-of-living data from 478 cities. Users can pan globally and zoom down to approximately 5.5 km cells, allowing for granular, location-specific analysis that goes beyond broad regional averages. This feature transforms raw data into a visual and intuitive exploration experience, helping users identify promising areas at a glance.
Pin and Compare Mode
This feature allows users to pin up to 20 locations, which are saved across sessions for ongoing research. By setting a current home as a baseline, the Compare mode transforms every metric for pinned places into a relative delta. Instead of just seeing absolute numbers, users see how much more sunshine, how much cheaper the cost of living, how much safer the geopolitical risk, or how differently the tax regime is compared to their current reality. This relative comparison is critical for making informed trade-offs, as it grounds abstract data in the user's personal experience. The feature effectively answers the question, "How does this place differ from where I am now?" making the decision process more tangible and actionable.
AI-Powered Shortlist Reasoning
The integrated AI assistant is a unique feature that operates exclusively on the user's pinned locations, not a generic knowledge base. This ensures that every answer is directly relevant to the user's specific shortlist. Users can ask complex, comparative questions like "Which of my pinned places is best for a winter base?" or "Score my shortlist: sunshine, cost, and low tax combined." The AI reasons across all metrics for all pinned places in a single response, providing cited answers with data sources. This moves the user beyond simple data browsing to a conversational, analytical exploration of trade-offs, helping to synthesize information and uncover insights that a table of numbers might not reveal.
Calibrated and Ground-Truthed Data
Unlike many tools that rely on raw satellite data, GeoRank's climate layers are bias-corrected against 182 ground stations from locations as diverse as Reykjavik, Phoenix, and Sydney. This process, using a combination of SARAH-3 satellite observations, ERA5 reanalysis, and CHELSA data, corrects for common errors like overestimating sunshine in cloudy regions. The result is a significantly more accurate representation of local climates, especially in high-altitude and coastal microclimates. This commitment to data integrity ensures that users are making decisions based on reliable, real-world measurements rather than unverified models, building trust in the platform's outputs.
Use Cases
Comparing Two Candidate Cities for a Relocation
A user is torn between Tbilisi, Georgia, and Paphos, Cyprus, for a year-long stay. Using GeoRank, they pin both cities and set their current home in London as a baseline. They can instantly see that Paphos offers 3,140 sunshine hours per year versus Tbilisi's 1,987, and that both have favorable tax regimes for foreign-sourced income. The Compare mode reveals that Paphos is approximately $700 per month more expensive, but offers EU infrastructure. The user can then ask the AI, "I'm a freelancer on a UK passport. Which city is better for low tax and high sunshine?" The AI provides a direct, cited comparison, helping the user understand the key trade-off between cost and climate.
Evaluating a Shortlist for a Family Relocation
A family of four is considering moving from the US to either Lisbon, Portugal, or Medellin, Colombia. They pin both locations and use the layers to assess geopolitical risk, cost of living, and visa pathways. The Geopolitical Risk layer shows Medellin has a higher risk score, while the Cost of Living layer indicates it is significantly cheaper. The Visas layer shows their US passports allow for a longer stay in Portugal under a D7 visa compared to a tourist visa in Colombia. The AI can then answer a nuanced question like, "What are the tradeoffs between Lisbon and Medellin for a family?" It would synthesize the data on safety, cost, education access, and visa stability, providing a holistic comparison that a simple list of numbers cannot.
Finding a Winter Base for a Digital Nomad
A digital nomad wants a place with at least 2,800 sunshine hours and low income tax for the winter months. They use GeoRank to explore the map, toggling the sunshine and tax layers. They pin five promising locations: Paphos, Tbilisi, Chiang Mai, Medellin, and the Canary Islands. In Compare mode, they see that Paphos and the Canary Islands exceed the sunshine threshold, while Tbilisi and Chiang Mai fall short. The AI then answers, "Which of my pinned places is best for a winter base?" It ranks them based on the user's stated criteria, highlighting that Paphos is the best fit due to its sunshine and tax regime, while noting the cost trade-off. This allows the user to quickly eliminate unsuitable options and focus on the top contenders.
Analyzing the Impact of a Passport on Relocation Options
A user with a UK passport wants to understand their visa-free and residency options across multiple destinations. They use GeoRank's Visas layer, which covers 47 destinations and 10 passports. By pinning locations like Spain, Thailand, and the UAE, they can instantly see the maximum allowed stay for their passport. The Compare mode shows that Spain allows 90 days out of 180, Thailand allows 30 days (or longer with a visa), and the UAE allows 30 days. This feature helps the user understand the bureaucratic reality of their choices, allowing them to factor in visa runs or the need for a formal residency application as a key decision point alongside climate and cost.
Pricing
GeoRank is completely free to use. There are no pricing plans, subscription tiers, or hidden costs. All features, including the interactive map, all 9 data layers, the pin and compare functionality, and the AI chat assistant, are accessible without any payment or registration.
Frequently Asked Questions
Is GeoRank really free to use?
Yes, GeoRank is completely free to use and requires no signup or account creation. All features, including the interactive map, all 9 data layers, the pin and compare functionality, and the AI chat assistant, are accessible without any payment or registration. The platform is designed to be an open and accessible tool for anyone researching a relocation, removing any barriers to entry.
How accurate is the climate data on GeoRank?
The climate data is highly accurate due to a rigorous calibration process. Raw satellite data from sources like SARAH-3 is bias-corrected using ground truth measurements from 182 weather stations worldwide. This process corrects for common errors, especially in cloudy or high-altitude regions. While accuracy is generally within +/-8% for most locations, users should be aware that coastal microclimates and high-altitude areas may have a wider margin of error, estimated at +/-20% and +/-15% respectively.
How does the AI assistant work, and what can I ask it?
The AI assistant operates exclusively on the data from your pinned locations. It does not access a general knowledge base, ensuring its answers are directly relevant to your shortlist. You can ask complex, comparative questions such as "Which of my 5 places has the best winter?", "Score my shortlist by sunshine, cost, and low tax", or "What are the tradeoffs between Paphos and Tbilisi for a family?" The AI will reason across all metrics for all pinned places and provide a cited, grounded answer, often in a comparative table format.
What data sources does GeoRank use for its layers?
GeoRank uses a variety of authoritative and specialized data sources. Climate layers (sunshine, temperature, rainfall) are powered by SARAH-3 satellite data, ERA5 reanalysis, and CHELSA, calibrated against 182 ground stations. Tax data is sourced from the OECD, PwC, and KPMG tax databases. Visa and residency information covers 47 destinations and 10 passports. Cost of living data is aggregated from 478 cities. Geopolitical risk is derived from global risk indices, and the "Nomad Pulse" layer is from community-sourced social sentiment.
Similar to GeoRank

Orlyn
Privacy-first, cookieless analytics that connects website traffic to real revenue. Sub-1KB script, no cookie banners.

Hotel Lobby AI Video Generator
Turn two photos into a Hotel Lobby dance video in the orange A COLORS SHOW booth
GetYouTubeTranscript
Free YouTube transcripts on the web, a Chrome extension, and an API + MCP server so AI assistants can read YouTube.




AIdorable
Adopt a virtual baby who grows, learns, and remembers you.