

tool Details
Explore More
Alternatives
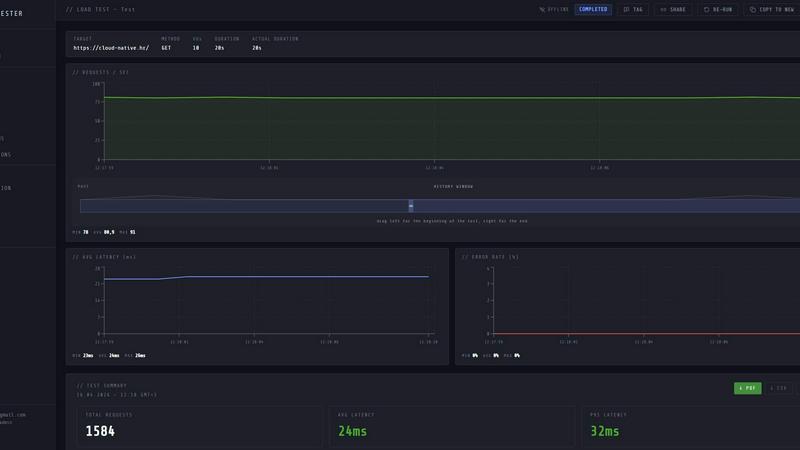
About LoadTester
LoadTester is a modern, cloud-native HTTP and API load testing tool built by Cloud Native d.o.o. for engineering teams that need repeatable, reliable performance checks without the overhead of managing infrastructure. It enables developers, QA engineers, and site reliability teams to design, execute, and analyze load tests directly from a browser or through CI/CD pipelines, eliminating the traditional pain points of provisioning servers, configuring workers, or waiting for cold starts. The platform supports running tests with up to 10,000 virtual users or 10,000 requests per second, achieving cold starts in under three seconds, and provides live streaming analytics for throughput, latency distributions (p50, p95, p99), and error rates as the test runs. LoadTester is designed for teams that want to catch performance regressions before users notice, compare runs side by side, set automated thresholds for auto-stop, and schedule baseline tests for continuous monitoring. It includes robust export capabilities (PDF, CSV, JSON), webhooks, Slack and email alerts, and full API access for workflow integrations. Whether you are validating a new endpoint, spike testing a checkout flow, or gating a release, LoadTester moves performance testing from a cumbersome, periodic chore into a fast, repeatable, and integrated part of your development lifecycle. A free plan is available, making it accessible for small teams and individual developers to start immediately.
Features
Instant Distributed Execution
LoadTester eliminates the operational burden of load testing by providing instant, distributed execution without any infrastructure setup. You do not need to provision servers, orchestrate workers, or manage queues. Simply create a test, choose your mode (virtual users or requests per second), set the target URL and duration, and hit run. The platform automatically dispatches workers, scales them as needed, and begins generating traffic within three seconds. Cold starts are virtually eliminated, and the queue time is zero milliseconds. This means your team focuses entirely on analyzing results and improving performance, not on the mechanics of running a test.
Live Streaming Telemetry
While your test is running, LoadTester provides real-time, streaming analytics that update every second. You can watch key metrics like requests per second (RPS), p50, p95, and p99 latency, active virtual users, and error counts change live on an interactive dashboard. A latency distribution chart shows the trend over the last 60 seconds, allowing you to spot bottlenecks or degradation as they happen. This live visibility is critical for understanding how your application behaves under load in the moment, rather than waiting for a post-run report. It turns a static test into an interactive debugging session.
Smart Auto-Stop with Thresholds
LoadTester includes intelligent guardrails that automatically stop a test when predefined conditions are breached. You can set thresholds for p95 latency, error rate percentage, or regression against a previous baseline run. When a threshold is crossed, the test stops immediately, preventing wasted resources and further strain on your system. This is especially valuable for automated CI/CD pipelines where you want a fast fail on performance degradation. Thresholds can also trigger webhooks to notify Slack channels, email recipients, or release bots, ensuring the right people are alerted instantly.
Automation and Integration Ecosystem
LoadTester is built for repeatable, automated performance checks. It offers full API access for programmatic test creation and execution, making it seamless to integrate into any CI/CD pipeline. Webhooks allow you to send result links to release bots or chat platforms upon test completion. Scheduled tests enable nightly or hourly baselines that run automatically, providing a continuous view of performance trends over time. Slack and email alerts ensure the team is notified of failures or regressions without manual polling. This ecosystem transforms load testing from a manual, occasional task into an automated, continuous part of your software delivery process.
Use Cases
Pre-Release Performance Gating
Before deploying a new feature or a major update to production, engineering teams can use LoadTester to run a comprehensive load test against the staging environment. By setting strict p95 latency and error rate thresholds, the test acts as a performance gate. If the new code introduces a regression or fails under load, the test auto-stops and alerts the team via Slack, blocking the release until the issue is resolved. This ensures that performance degradation never reaches end users, maintaining a high-quality experience with every deployment.
Spike and Capacity Testing for E-Commerce
E-commerce platforms experience unpredictable traffic spikes during sales events, product launches, or holiday seasons. LoadTester allows teams to simulate these spikes by generating a high rate of requests per second (up to 10,000) against critical endpoints like checkout, search, or authentication. Live analytics show real-time latency and error rates, helping teams identify bottlenecks in the checkout flow or database layer. The results can be exported and shared with stakeholders to prove capacity and ensure the application can handle the anticipated load without crashing.
Continuous Performance Monitoring via Scheduled Baselines
For teams that need ongoing visibility into application performance, LoadTester supports scheduled tests that run daily, hourly, or at custom intervals. These baseline tests run against the same endpoints with the same parameters, generating a historical record of performance metrics. Run-to-run comparisons highlight trends, such as gradual increases in p95 latency or error rates, allowing teams to catch regressions early. This is ideal for microservices architectures where a single team’s change can impact downstream services, and continuous monitoring is essential for maintaining service level objectives (SLOs).
CI/CD Pipeline Integration for Automated Regression Detection
DevOps and platform engineering teams can integrate LoadTester directly into their CI/CD pipelines using the API or webhooks. On every pull request or merge to the main branch, a load test is automatically triggered against the latest build. The test results are compared against a stored baseline, and if performance degrades beyond a defined threshold, the pipeline fails. This automated regression detection prevents performance bugs from being merged into production. It also saves time by removing the need for manual testing during code reviews.
Frequently Asked Questions
How does LoadTester handle infrastructure and scaling?
LoadTester is a fully managed service that handles all infrastructure behind the scenes. You do not need to provision any servers, configure load generators, or manage worker pools. When you launch a test, the platform automatically dispatches the required number of distributed workers, scales them to meet the target load, and begins generating traffic within three seconds. This includes scaling up to 10,000 virtual users or 10,000 requests per second. The queue time is zero milliseconds, and the system is designed for instant cold starts, so you can focus on testing, not setup.
Can I run load tests from my CI/CD pipeline?
Yes, LoadTester is designed for seamless CI/CD integration. You can use the full API to create, start, and monitor tests programmatically from your pipeline scripts. Additionally, you can set up webhooks that trigger tests on specific events, such as a new deployment or a pull request merge. The results are returned in a machine-readable format (JSON), and you can configure thresholds that cause the pipeline to fail if performance regressions are detected. This makes it easy to enforce performance gates as part of your automated release process.
What metrics are available during a live test run?
During a live test run, LoadTester streams a comprehensive set of real-time metrics. These include total requests per second (RPS), active virtual users (VUs), error count and error rate, and latency percentiles (p50, p95, p99). A latency distribution chart shows the trend over the last 60 seconds, allowing you to spot changes in performance instantly. After the test completes, you also receive a summary with total requests, average latency, data sent and received, and a full breakdown of errors. All data can be exported as PDF, CSV, or JSON for further analysis.
Is there a free plan and what are the limits?
Yes, LoadTester offers a free plan that allows you to get started without any upfront cost. The free plan includes a limited number of test runs per month and a cap on the maximum load (virtual users or requests per second) you can generate. For teams that need higher concurrency, longer test durations, or advanced features like scheduled tests, API access, and priority support, paid plans are available. You can view the specific limits and pricing details on the LoadTester pricing page. The free plan is ideal for individual developers or small teams who want to evaluate the tool or run occasional tests.
Similar to LoadTester

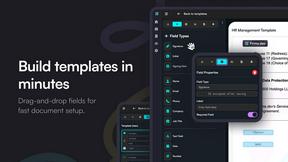
Firma.dev
Pay-as-you-go e-signature API and no-code sending. €0.049 per envelope, no monthly minimums, legally valid in 55+ countries.

AIQualityHQ
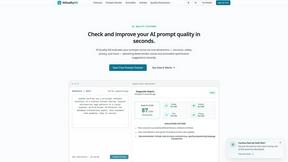
AIQualityHQ checks your AI prompts for structure, safety, and privacy in milliseconds, delivering instant scores and fixes.