tool Details
Explore More
Alternatives
About ProcessSpy
ProcessSpy represents the evolution of macOS system monitoring, born from a developer's practical frustration into a professional-grade tool. It began when its creator, Robert, needed to manage multiple Java applications but found Apple's native Activity Monitor insufficient, showing only generic "java" process names without critical details like version or path. This gap in visibility sparked the development of ProcessSpy, a native macOS application designed to be the definitive process explorer for power users, developers, and IT professionals. It serves as the spiritual successor to tools like Sysinternals Process Explorer for the Windows platform, but built from the ground up with a deep commitment to the macOS ecosystem. Its core value proposition is revealing everything Activity Monitor hides: detailed process hierarchies, open files and network connections, environment variables, and comprehensive metadata. ProcessSpy empowers users to diagnose stubborn application hangs, analyze system resource consumption in aggregate, and gain deep insights into software behavior, transforming system monitoring from a basic task into an advanced analytical process. Its growth from a simple utility to a feature-rich suite, including advanced paid capabilities, mirrors the user's own journey from needing basic answers to demanding forensic-level detail for complex troubleshooting and optimization.
Features
Advanced Hierarchical Process Tree
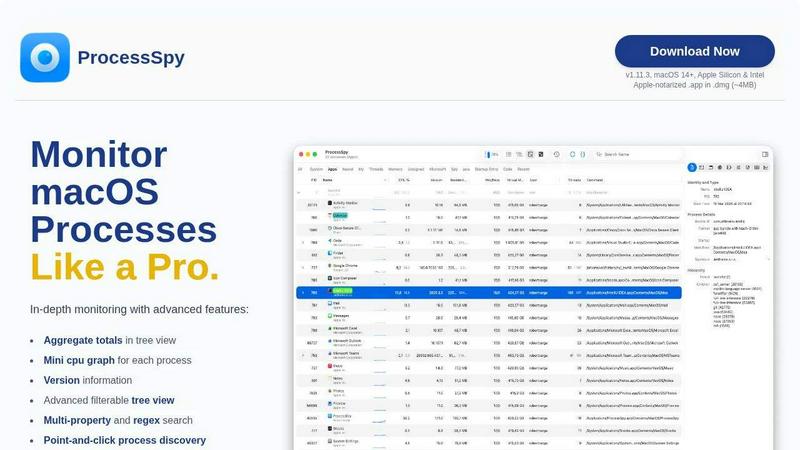
ProcessSpy visualizes your system's activity not as a flat list, but as a dynamic, collapsible tree that clearly shows parent-child relationships between processes. This evolutionary step in system monitoring allows you to understand which application launched which service or daemon. Crucially, it calculates and displays aggregate totals for CPU, memory, and thread usage for any branch of the tree, providing immediate insight into the total resource impact of an entire application suite, not just its individual components.
Multi-Property and Regex Search
Moving beyond simple name matching, ProcessSpy's search functionality is engineered for precision. It supports regular expressions and simultaneous searches across multiple process properties. For instance, you can find all processes with "node" in the name that also have a specific port number in their command-line arguments. This advanced filtering represents a significant growth from basic tools, enabling users to quickly isolate processes based on complex, real-world criteria essential for debugging and system analysis.
JavaScript-Powered Custom Filters
For users whose monitoring needs evolve beyond predefined options, ProcessSpy offers a powerful scripting interface. You can write custom filters in JavaScript to evaluate processes against complex, multi-condition logic. This feature transforms the tool from a static viewer into a dynamic analysis platform, allowing for personalized automation and detection scenarios that grow with your expertise, such as flagging processes that match a very specific set of resource and metadata conditions.
Comprehensive Process Context & History
ProcessSpy elevates monitoring by providing rich context and memory. It displays version information and bundle details directly in the main view. The paid tier unlocks deeper inspection, including environment variables, code signatures, entitlements, and the Info.plist. Furthermore, it can record historical metrics (CPU, memory) and, uniquely, remember finished processes with their full details for later forensic review, closing the gap left by tools that only show the current state.
Use Cases
Debugging and Isolving Stubborn Application Hangs
When an application becomes unresponsive, basic tools offer little help. ProcessSpy allows developers and support professionals to drill down. You can inspect the full process tree to see if a child process is frozen, check what files or network connections it has open, and use the advanced information to understand its state. This detailed context is the key to diagnosing whether the issue is a deadlock, a waiting I/O operation, or a resource leak, enabling a targeted fix rather than a forced reboot.
Managing and Profiling Development Environments
Developers often run multiple instances of interpreters like Java, Python, or Node.js, each with different versions and arguments. ProcessSpy cuts through the confusion by showing the full command line, path, and version for each process. You can instantly distinguish between your Java 11 microservice and your Java 17 application server, and use aggregate tree views to profile the total resource consumption of your entire development stack, facilitating efficient resource management.
System Security and Software Auditing
For security-conscious users and administrators, ProcessSpy acts as a transparency tool. You can audit running processes to identify unknown or suspicious software, check code signatures and entitlements to verify legitimacy, and inspect environment variables for sensitive data leakage. The ability to see all open files and network connections for any process provides a clear map of software behavior, essential for security posturing and compliance checks.
Performance Optimization and Resource Analysis
Beyond killing tasks, ProcessSpy is for optimization. The hierarchical view with aggregate totals helps identify which application families are the true resource hogs. Recording historical metrics (paid feature) allows you to track memory creep or CPU spikes over time, correlating them with specific events. This data-driven approach enables you to make informed decisions about software choices, configuration tweaks, and upgrade priorities based on actual system impact.
Frequently Asked Questions
Is ProcessSpy safe to install on my Mac?
Yes, ProcessSpy is designed with macOS security and integration as a core principle. The application is Apple-notarized, meaning it has been checked by Apple for malicious content. It is distributed as a signed .app inside a .dmg file, ensuring its integrity. This native approach, without bloated cross-platform layers, makes it a safe and trusted tool for both Intel and Apple Silicon Macs running supported macOS versions.
What versions of macOS does ProcessSpy support?
ProcessSpy is built for modern macOS systems and supports macOS 14 (Sonoma) and newer, including the latest releases. It is fully compatible with both Apple Silicon and Intel architectures. This focus on recent OS versions allows the developer to utilize the latest native APIs and security features, ensuring optimal performance, stability, and access to advanced system information that may not be available on older operating systems.
What is the difference between the free and paid features?
The free version of ProcessSpy is a powerful tool on its own, offering the advanced process tree, multi-property search, JavaScript filters, and basic context viewing. The paid license unlocks professional-grade features for deeper analysis: viewing environment variables and advanced process info (entitlements, Info.plist), recording process history metrics, exporting data to CSV, and the unique ability to remember and review details of finished processes for forensic analysis.
What does the license include?
A ProcessSpy license is a one-time purchase of $24.99 that grants lifetime access to all current and future paid features. The license is per user, not per machine, meaning you can use it on an unlimited number of your own Mac devices. This model supports the ongoing evolution and development of the tool, ensuring you receive updates and new capabilities as the application grows, without subscription fees.
Similar to ProcessSpy

Enlisted
Search 20,000+ open-source and SaaS tools by the job you need done or the app you want to replace.

Egmatic
No-code 2D game editor: visual node logic, drag-and-drop scenes, live preview. Exports to Windows, macOS, Linux, Android, iOS, Web.

Product Launch Checklist
A free launch checklist for SaaS, apps, AI tools and more. Every step says why it matters and when you can skip it.


laya.tools
Free directory of 950+ projects built on Laya, the open-source model that turns text into typed decisions. Ports, SDKs, agents and demos.

Forms Plugin
The #1 Native Form Builder Plugin for Framer - No Code, No Embeds, No External Platforms.