
StatPecker
StatPecker evolves from simple data queries to powerful visual stories for impactful business insights.
tool Details
Explore More
Alternatives
About StatPecker
StatPecker represents a significant evolution in data communication, moving beyond static spreadsheets to dynamic, intelligent storytelling. It is an AI-powered platform engineered to transform raw, complex data into compelling, publication-ready infographics and charts in seconds. This tool is designed for a new generation of professionals who need to communicate insights with clarity and impact, including content creators, data analysts, marketers, educators, and business teams. The core value proposition of StatPecker lies in its automation of the entire visual data representation workflow. It eliminates the traditional bottlenecks of manual design, costly software, and technical charting expertise, allowing users to focus on analysis and narrative rather than intricate design processes. By making data instantly accessible, understandable, and visually engaging, StatPecker empowers users to share credible, impactful stories that drive decisions and captivate audiences. Its growth is marked by a commitment to user-centric innovation, as seen in its expanding feature set that now includes private, on-device data analysis, reflecting its progression towards becoming an indispensable partner in the data-driven workflow.
Features
Local SQL Agent
This groundbreaking feature ensures complete data privacy and control. You can upload a CSV file (up to 50 MB) directly to your device, where StatPecker's local engine prepares and analyzes it without ever sending your sensitive information to the cloud. Ask natural language questions about your data, and receive instant answers visualized as clean, ready-to-share charts, all processed securely on your own machine.
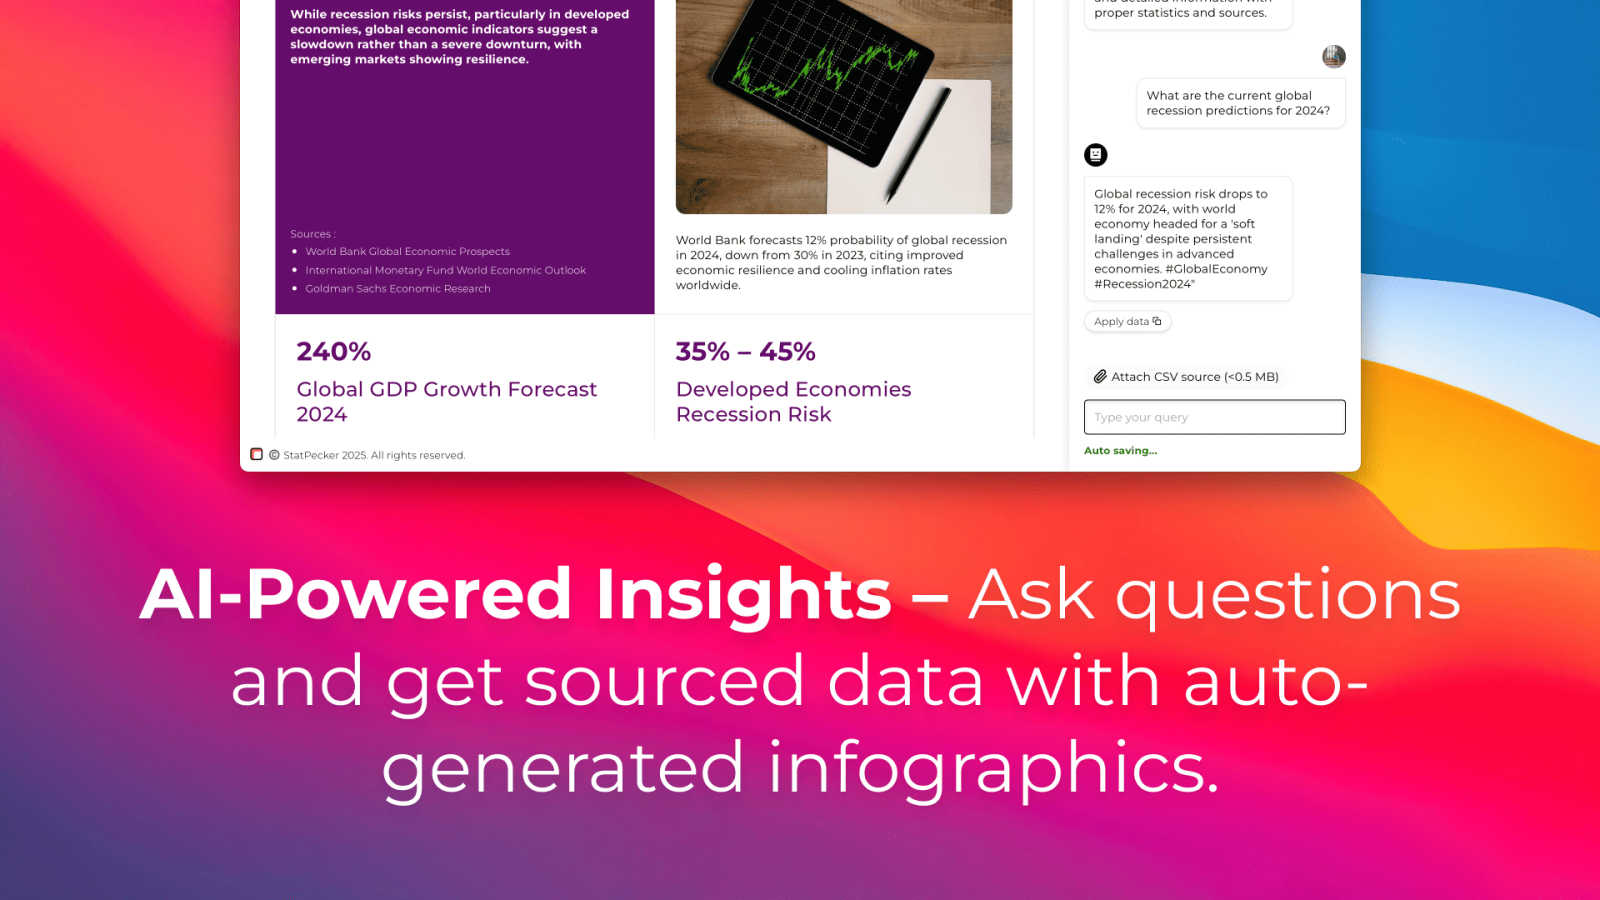
Ask Your Query
Move beyond complex query languages and dashboard configurations. Simply type your question about your data or a topic into StatPecker's intuitive interface. The AI leverages validated sources to generate instant insights, which are then automatically transformed into clear visualizations. This feature democratizes data analysis, making powerful insights accessible to everyone regardless of their technical background.
Publish & Embed
StatPecker doesn't just create visuals; it ensures they are actionable and integrated into your workflow. The platform allows you to make your generated infographics interactive and seamlessly embed them into blogs, articles, websites, or internal wikis. This turns static reports into living documents and enhances the credibility and engagement of your published content with professional, data-backed visuals.
Download & Use Anywhere
For maximum flexibility, every infographic and chart created with StatPecker can be exported as a high-quality image file. This enables you to instantly use your data visuals in reports, slide decks, presentations, social media, and print materials. This feature guarantees that your insights are portable and can enhance storytelling across any medium or platform you use.
Use Cases
Content Creation & Blogging
Content writers and bloggers use StatPecker to rapidly find and visualize data that supports their narratives. Instead of describing trends, they can embed interactive charts directly into their articles, boosting SEO, reader engagement, and the authoritative credibility of their posts with tangible, AI-generated evidence.
Business Reporting & Analysis
Analysts and managers streamline their weekly or monthly reporting processes. By uploading sales, marketing, or operational CSVs to the Local SQL Agent, they can privately ask specific questions, identify key performance drivers, and generate a suite of professional charts for stakeholder presentations in a fraction of the traditional time.
Marketing & Social Media Strategy
Marketing teams leverage StatPecker to create stunning, data-driven infographics for social media campaigns, email newsletters, and investor updates. The ability to quickly turn campaign metrics or market research into compelling visual stories helps capture audience attention and communicate performance effectively.
Educational Instruction
Educators and trainers utilize StatPecker to bring data to life in the classroom or in training materials. They can transform abstract statistical concepts or historical trends into clear, engaging visuals that enhance student comprehension and make learning more interactive and memorable.
Frequently Asked Questions
How does the Local SQL Agent ensure my data is private?
The Local SQL Agent is designed with privacy as its default state. When you upload a CSV file, the entire preparation and analysis process occurs directly on your device. Your raw data never leaves your computer to be sent to external servers. The AI generates queries and renders visuals locally, ensuring your sensitive business or personal information remains completely secure and under your control.
What is included in the Free Tier?
The Free Tier offers a robust starting point for new users. It includes unlimited projects and embeds (with manual edits), allowing you to create and integrate a significant number of visuals. You also receive 25 AI queries to ask questions and generate insights, along with 10 CSV uploads to analyze your private data, providing ample resources to evaluate and begin using the platform's core capabilities.
What does "Lifetime Access" mean for the paid plan?
The Lifetime Access plan is a one-time payment that grants you permanent access to StatPecker's full feature suite. This includes unlimited AI queries, unlimited CSV uploads, unlimited projects and embeds, and all current and future premium features. It also includes priority consideration for feature requests and is backed by a 10-day, no-questions-asked refund policy.
Can I edit the infographics after StatPecker creates them?
Yes, StatPecker provides flexibility for refinement. While the AI generates the initial visual based on your query or data, the platform includes tools for manual edits. You can adjust chart types, colors, labels, and other design elements to perfectly align the infographic with your brand guidelines or specific presentation needs before publishing or downloading.
Similar to StatPecker


Vogue AI
Prompt gallery for AI image generation — browse proven prompts, swap your subject, keep the style.
Easymotion - AI Motion Graphic Generator
AI motion graphics and map animation generator for content creators, editors, founders and marketers.

EnsembleData
EnsembleData offers real-time APIs for scalable social media data scraping, empowering businesses to extract insights and drive growth.
Ribbi
Ribbi is your self-evolving AI agent that automates and enhances social media content creation for effortless growth and engagement.

Subiq
Subiq simplifies SaaS subscription management for small teams, tracking tools and expenses to eliminate wasted spend and forgotten renewals.

Toon Tone
Train your color perception daily by guessing original cartoon character hues using HSB sliders in five quick rounds.